
I’ve been running vRealize Operations, Aria Operations, and VCF Operations in my lab for quite some time now. Despite this, I’ve never gotten around to taking the time to actually create custom dashboards that reflect the status of my lab. That changed this year thanks to – let’s call it fate. I’ve finally got around to creating my own dashboards. These give me a rough overview of my lab, but also provide exactly the level of detail I want. There were a few challenges to overcome, such as visualising power consumption – specifically, the power drawn from the socket my lab is plugged into.
I’ve been using a Grafana solution for years that reads the power consumption via my UPS, but this time I wanted to take a different approach. So I planned to read the power consumption from the socket via a Shelly Plug S, which I’ve been using all along to keep an eye on power consumption. This meant I had to somehow read the Shelly S’s API to visualise it in my dashboard. To do this, you need a custom Management Pack in VCF Operations. In this blog post, I’ll show you how I created and configured it; a follow-up post will come later where I’ll show you how the dashboard takes shape.
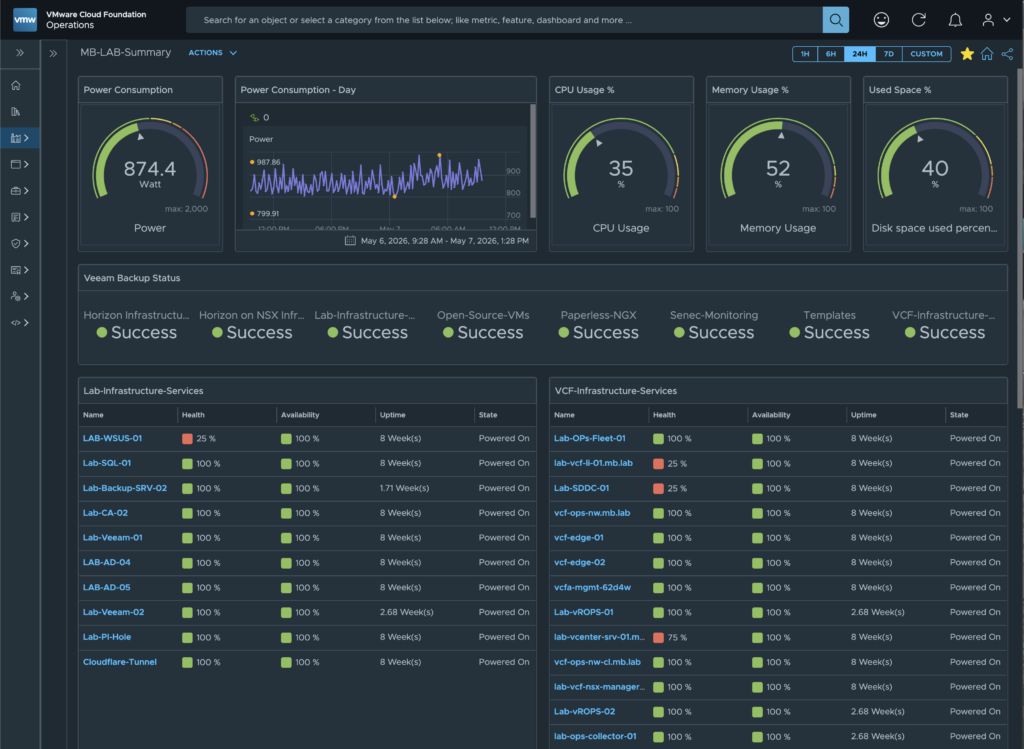
In the first part of this blog post series, we’ll focus on the first two widgets on the dashboard: “Power Consumption” and “Power Consumption – Day”. I’d like to show you how I retrieve the values for these widgets from the Shelly Plug S API so that they can be displayed on the dashboard. To do this, you’ll need a custom VCF Operations Management Pack; I’ll show you how to create and install it in the steps below.
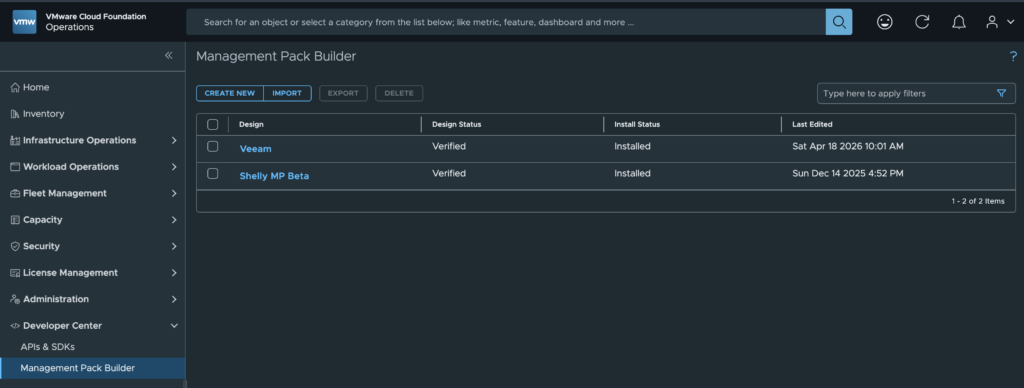
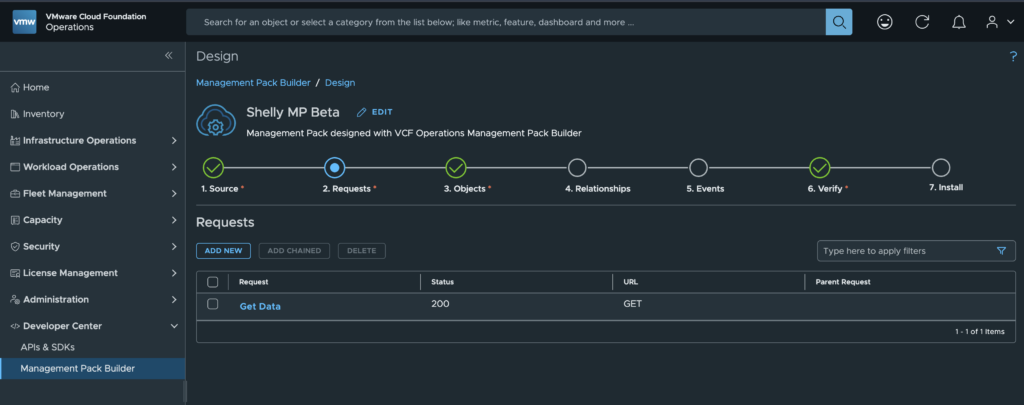
The starting point for creating a management pack is the ‘Management Pack Builder’, which you can find under ‘Developer Centre’ -> ‘Management Pack Builder’
There you will see the management packs you have already created, and you can create new ones using the ‘Create New’ button.
A Management Pack is always structured in the same way; see the ‘timeline’ above.
The first step is always to define the ‘Source’. In my case, I’m establishing the connection to the API of my Shelly Plug S here. As is unfortunately common with “cheap” IoT devices, the whole thing isn’t secured in any way, which actually makes my life a bit easier here. In a later blog post, I’ll also show you how to access an API that’s better secured; it’ll be the Veeam API, as I’ve also built a dashboard for my Veeam Backup environment. But now back to Shelly Plus S – no “https”, no “login”.
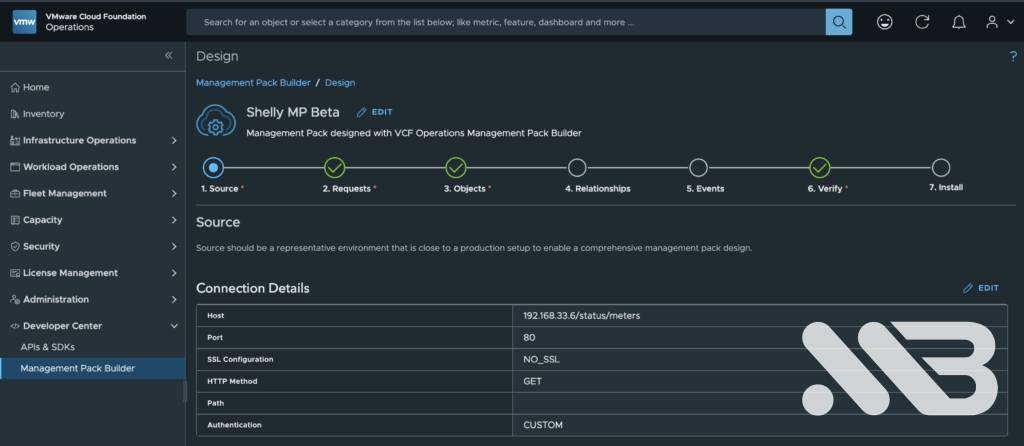
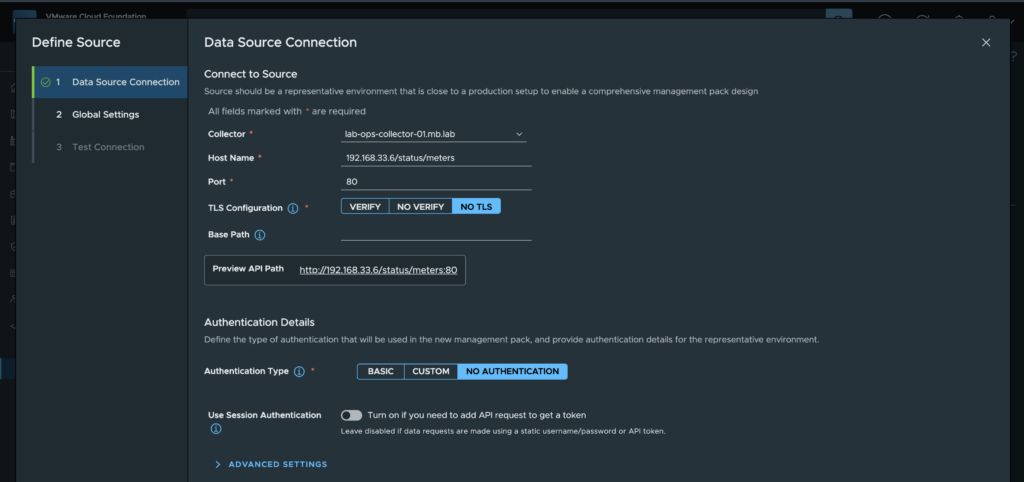
The ‘Data Source’ settings for this Management Pack are therefore quite straightforward.
I specify which of my collectors will establish the connection, followed by the API endpoint for the Shelly Plug S. In my case, this is ‘/status/meters’; the port is 80 as ‘https’ is not used, and TLS configuration is also not required as it is simply not used.
Authentication isn’t particularly complicated either, as no authentication is used at all.
The next step is to formulate the API requests; in my case, it’s relatively simple: “Get Data”
No special configuration is required here either; the ‘GET’ request simply retrieves everything the API provides.
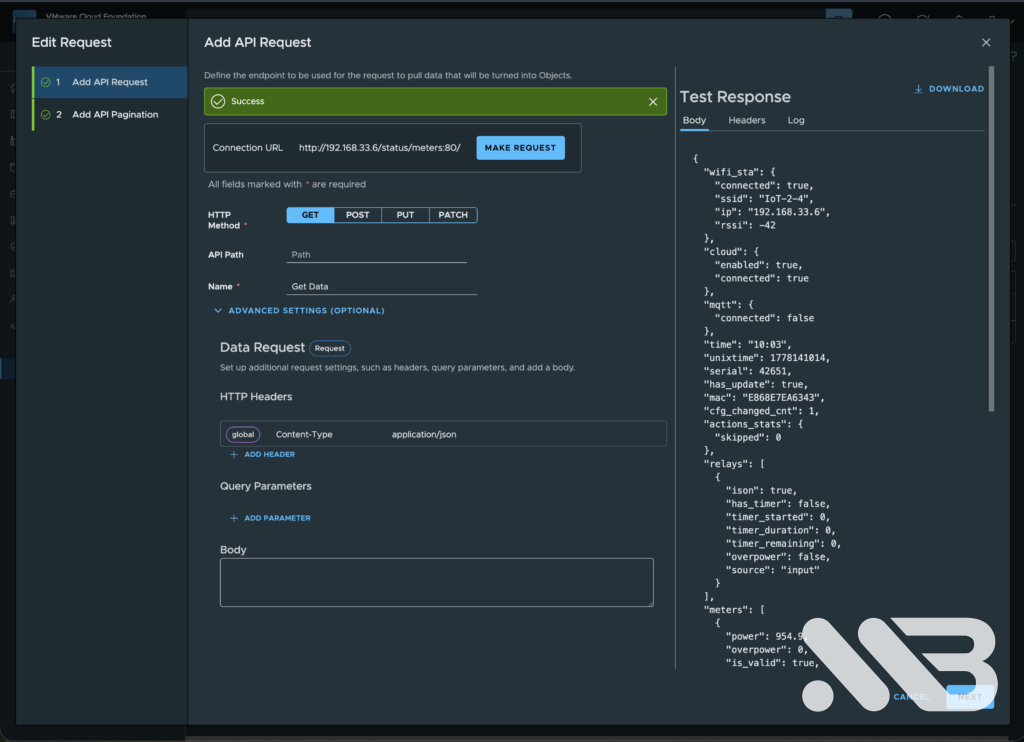
Once the API has been successfully retrieved, the next step is to define the objects retrieved from the API and how VCF Operations should handle them.
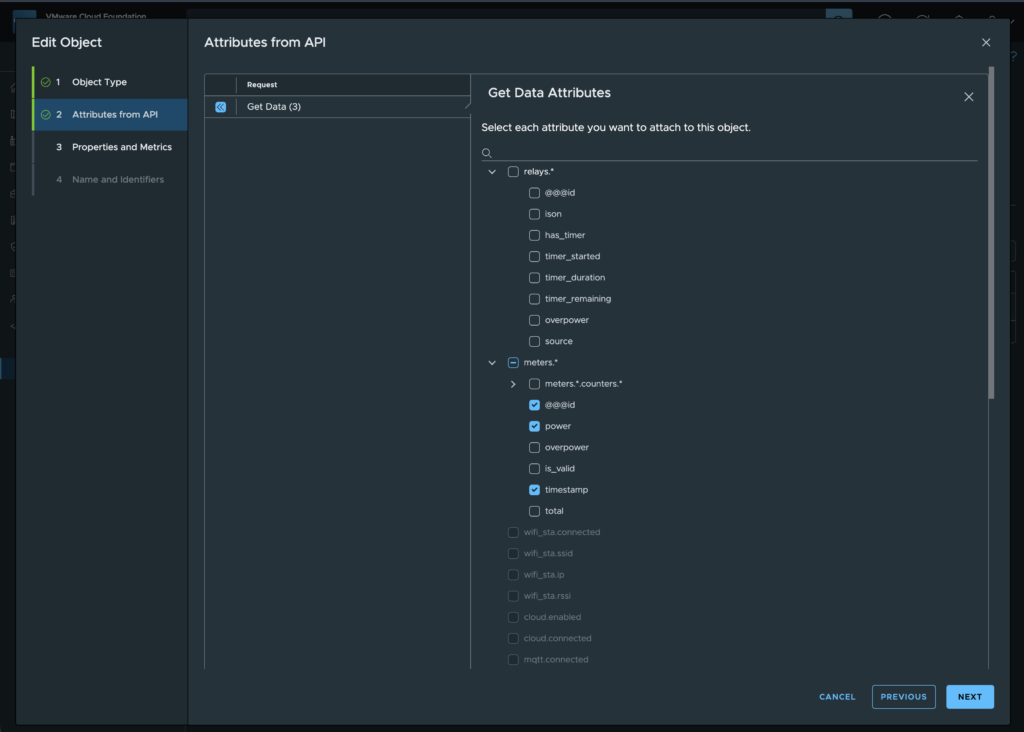
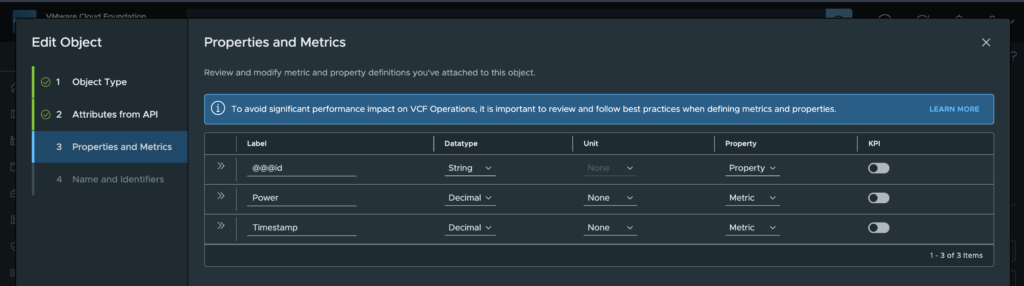
In my case, I only considered the ‘id’, “power” and ‘timestamp’ to be important, so I selected only those attributes.
In the following dialogue box, the attributes need to be defined in more detail; in my case, I did this as follows.
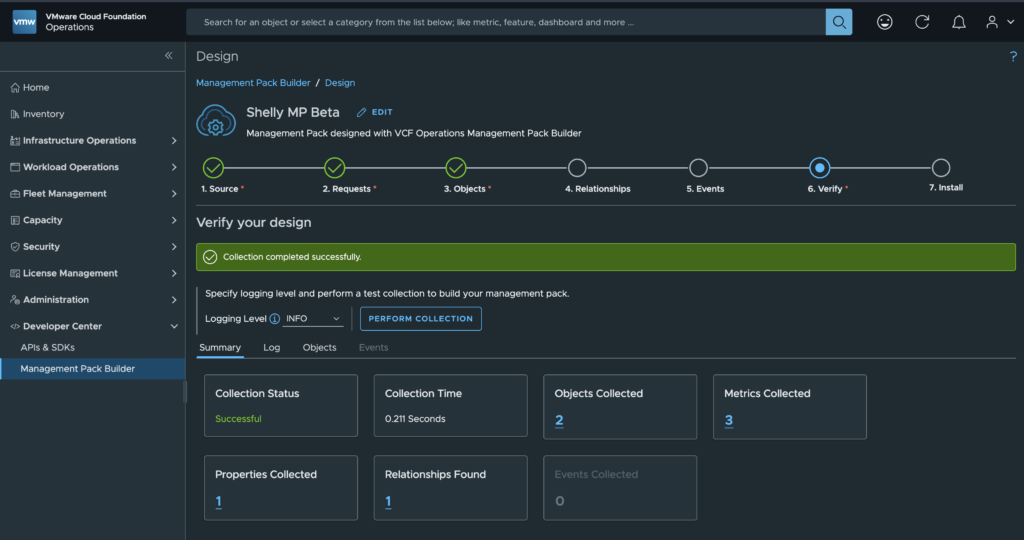
This completes the configuration of the Management Pack for the Shelly Plug S; the next step in the ‘Timeline’ is to verify the Management Pack before it can be finally installed in VCF Operations.
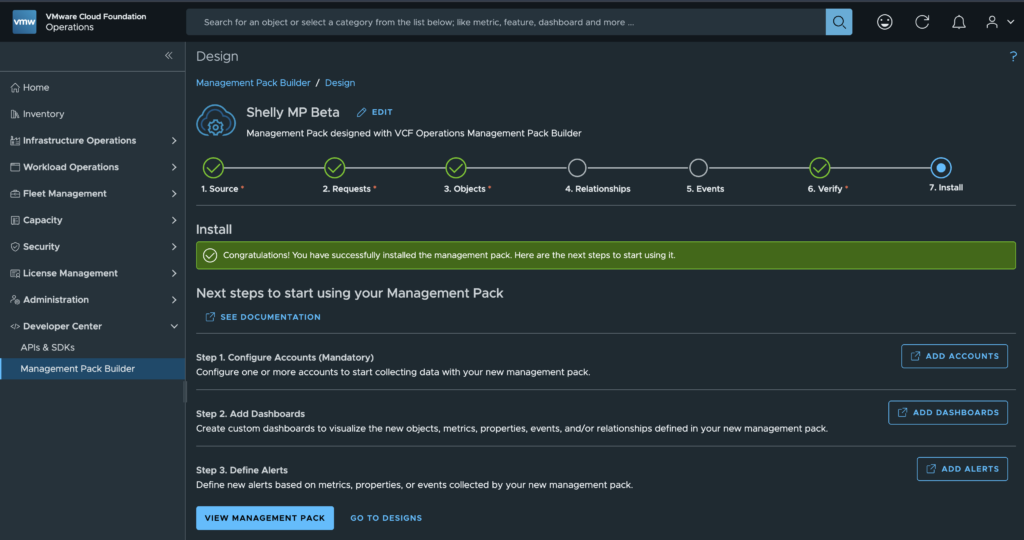
From my point of view, installing the Management Pack in VCF Operations is self-explanatory, so I haven’t taken any further screenshots of the process. If you do have any questions, please feel free to post them in the comments or simply contact me directly.
Now that the Management Pack has been built and installed, we can start displaying the data we’ve retrieved via the API on a dashboard. To do this, you use ‘widgets’ on the dashboard, and I’ll show you how to configure these widgets in the following steps.
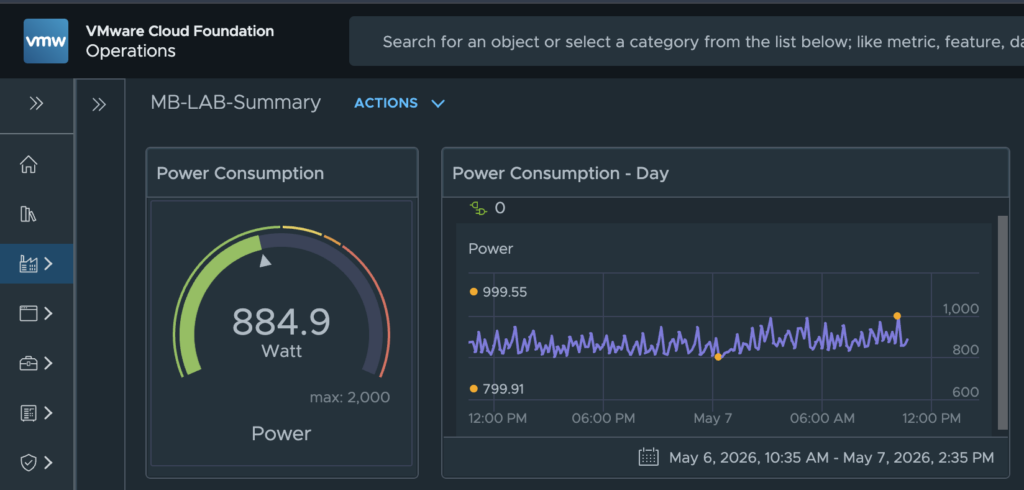
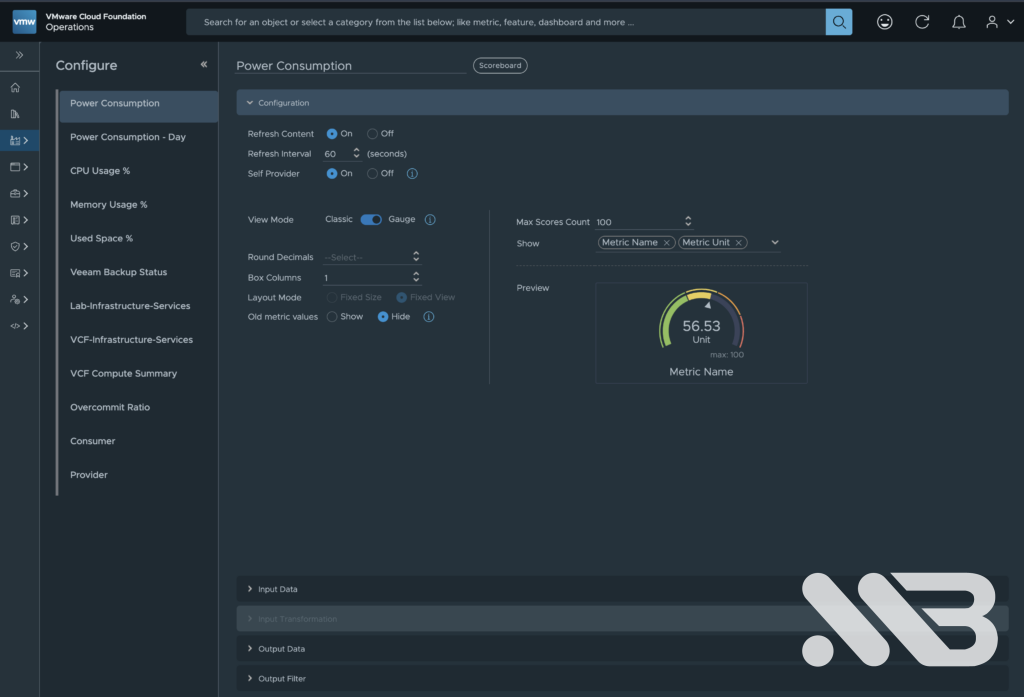
To display ‘Power Consumption’, I used a ‘Scoreboard’ widget and configured it accordingly.
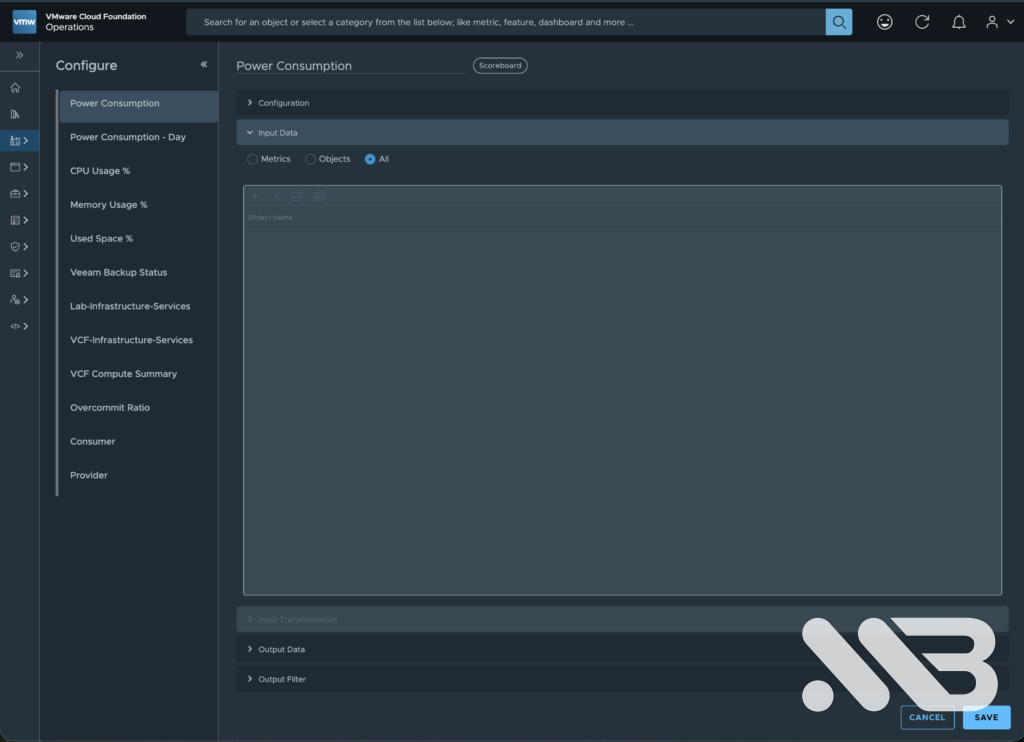
I have selected ‘All’ as the input data
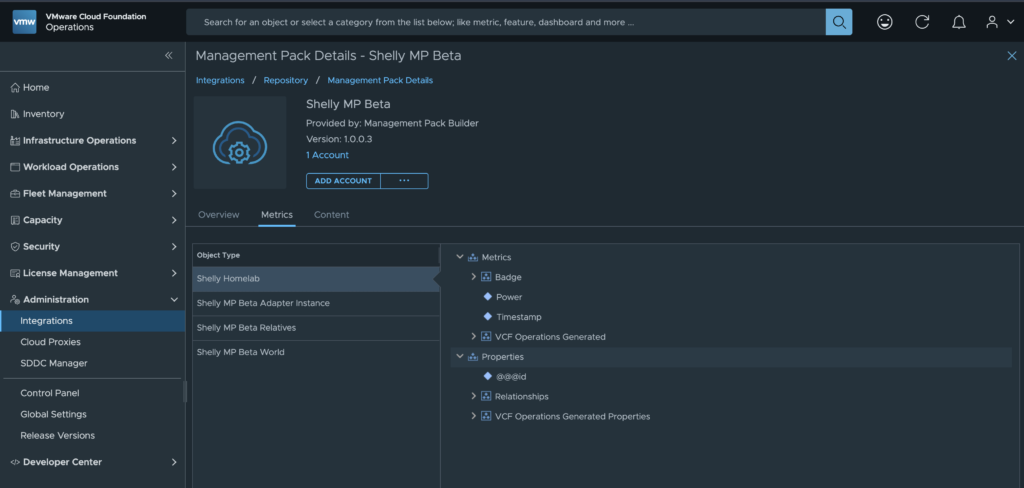
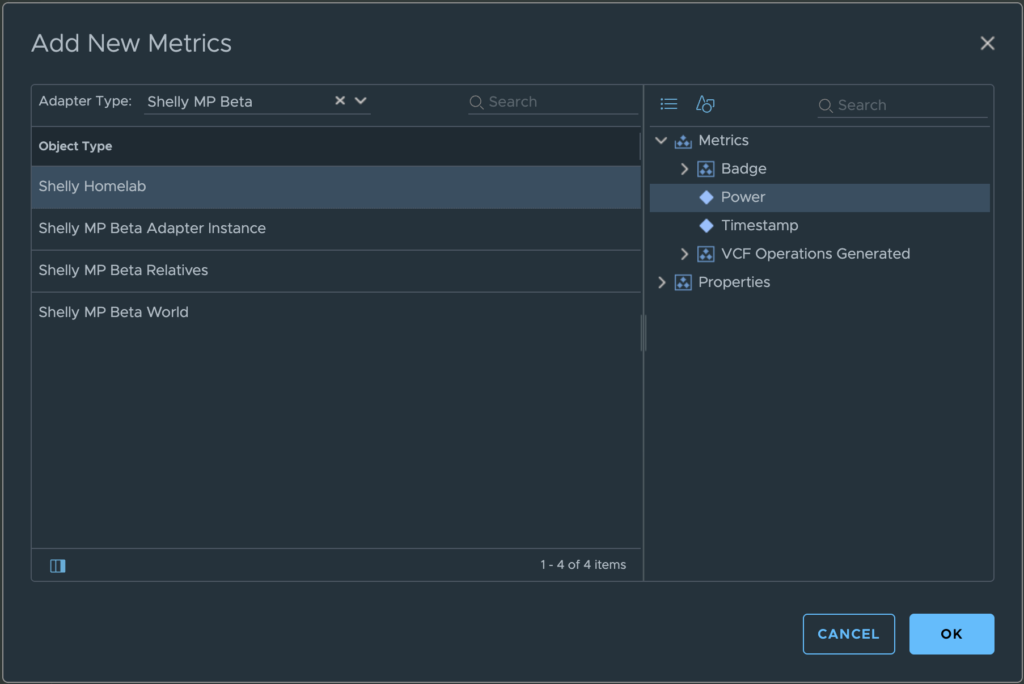
For the output data, I selected the ‘Shelly Homelab’ object from my management pack and then selected the ‘Power’ metric within it.
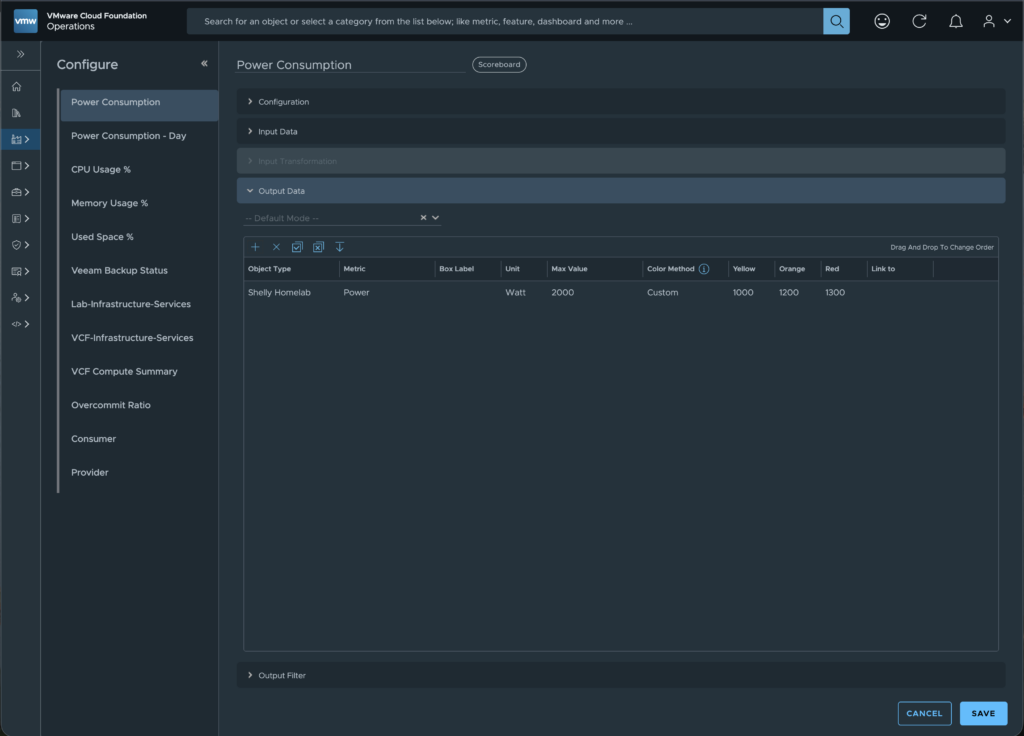
I have also defined ‘Watt’ as a unit, set a maximum value (in my case, ‘2000’) and defined the ranges in which the display should be ‘yellow’, ‘orange‘ or ‘red’. An output filter is not required for this widget.
The widget is now fully configured and you can use it on your dashboard.
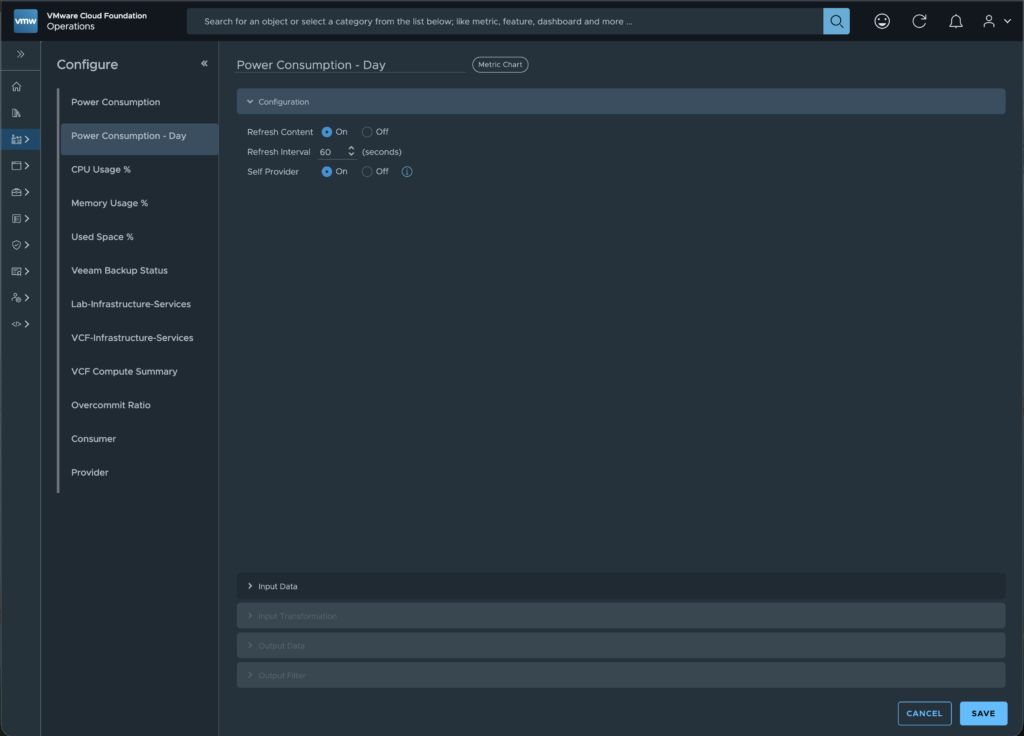
The ‘Power Consumption – Day’ widget is configured slightly differently; a different widget type is selected – in this case, it is ‘Metric Chart’ – and the widget is mainly controlled via ‘Input Data’, as this is where you select the metric to be displayed.
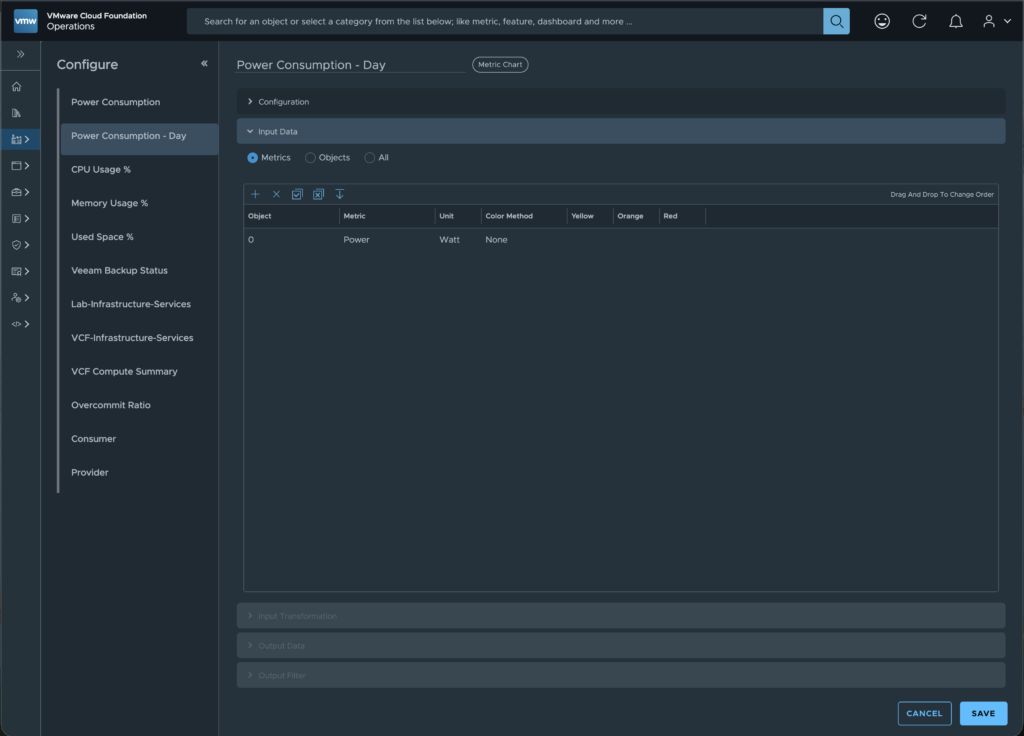
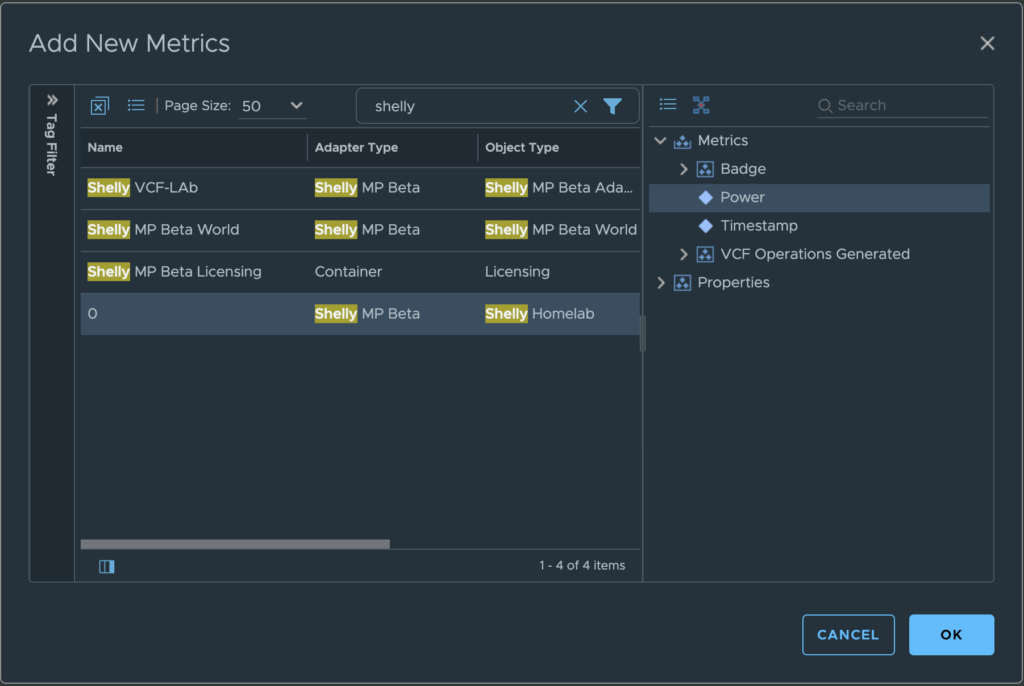
Here, too, I have selected the API metric ‘Power’ and also configured the unit as ‘Watt’. This widget is now fully configured and can be used on the dashboard.
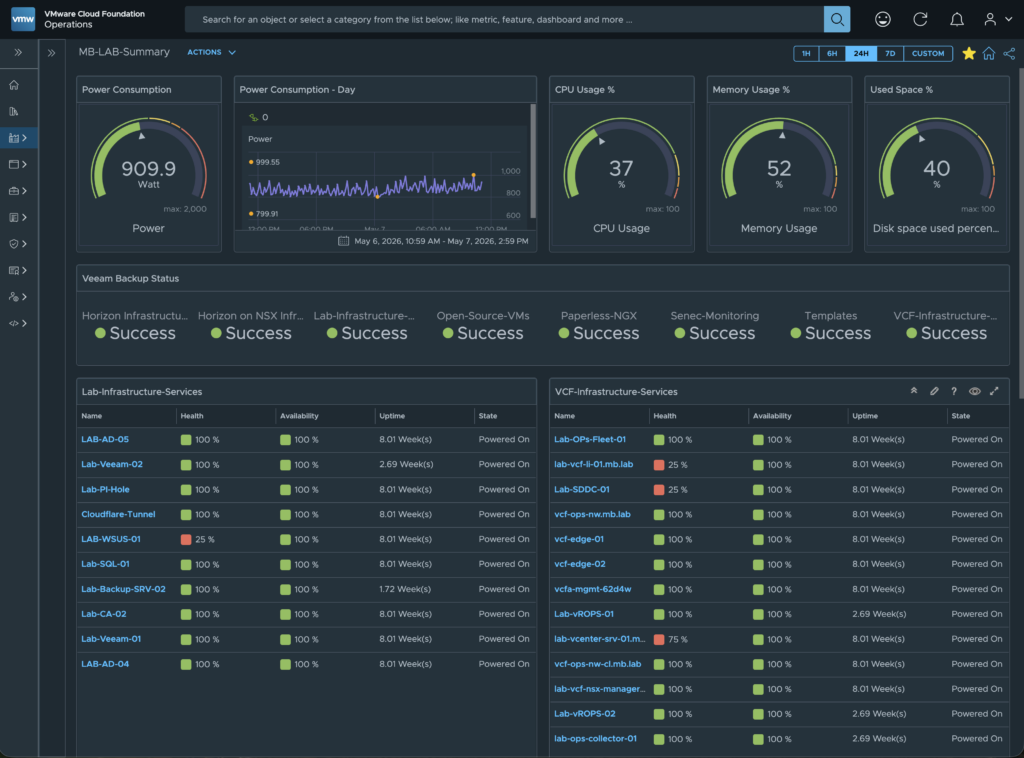
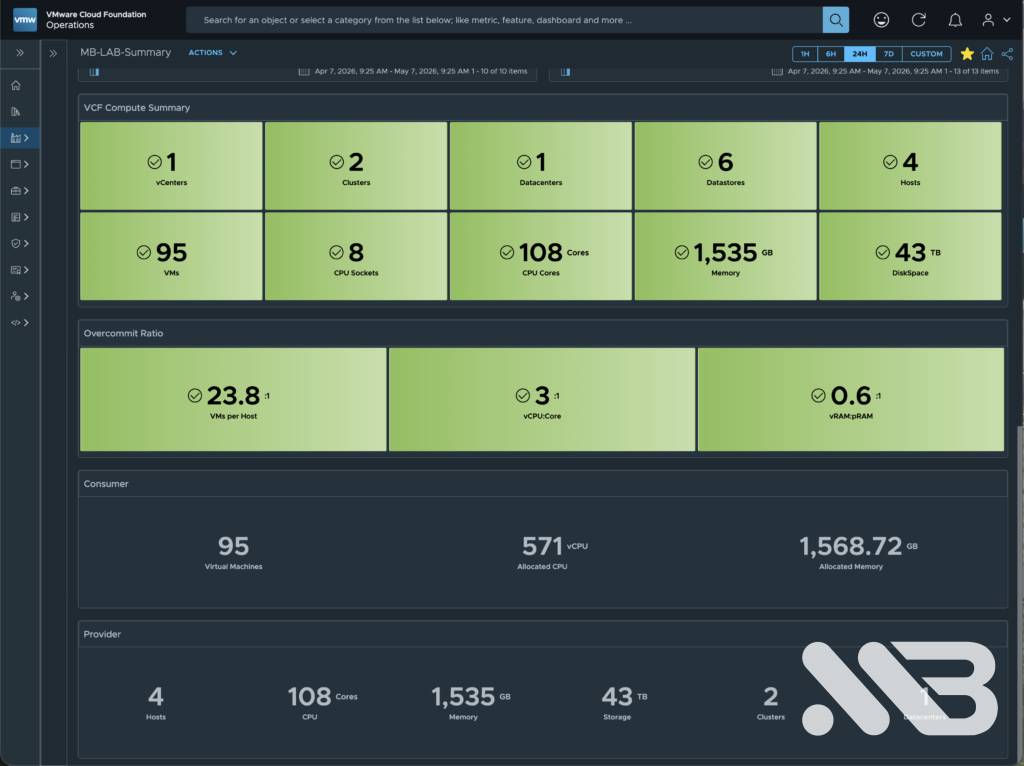
Here’s the final view of my dashboard once again.
I’d like to wrap up this part of the blog series for now, but as you can see, there are still more widgets and data on my dashboard that I’d be happy to explain to you in future blog posts.
Upcoming highlights include, for example, connecting a Veeam Backup environment to VCF Operations and displaying it on a dedicated dashboard. As a sneak peek, you can already see the Veeam Backup job status on my current dashboard.
Please feel free to let me know in the comments what else you’d be interested in, or contact me directly via email, the contact form, or – as most people do – via LinkedIn.
See you soon.
No responses yet